bpytop
Terminal-based system resource monitor showing CPU, memory, disk, network and process usage with interactive interface
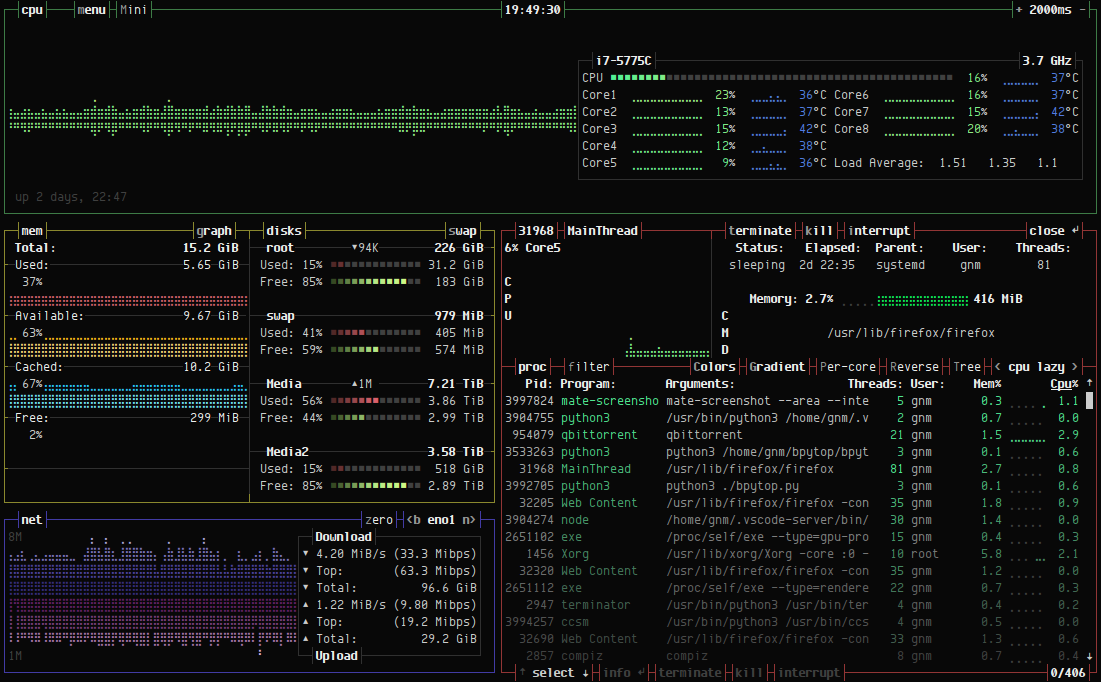
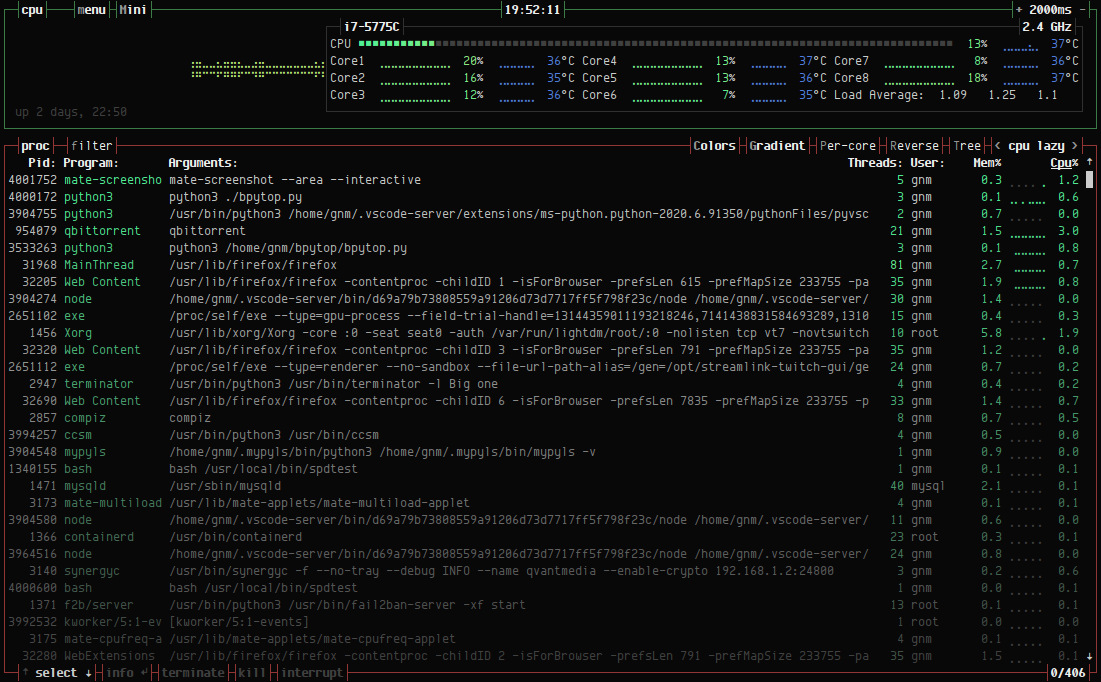
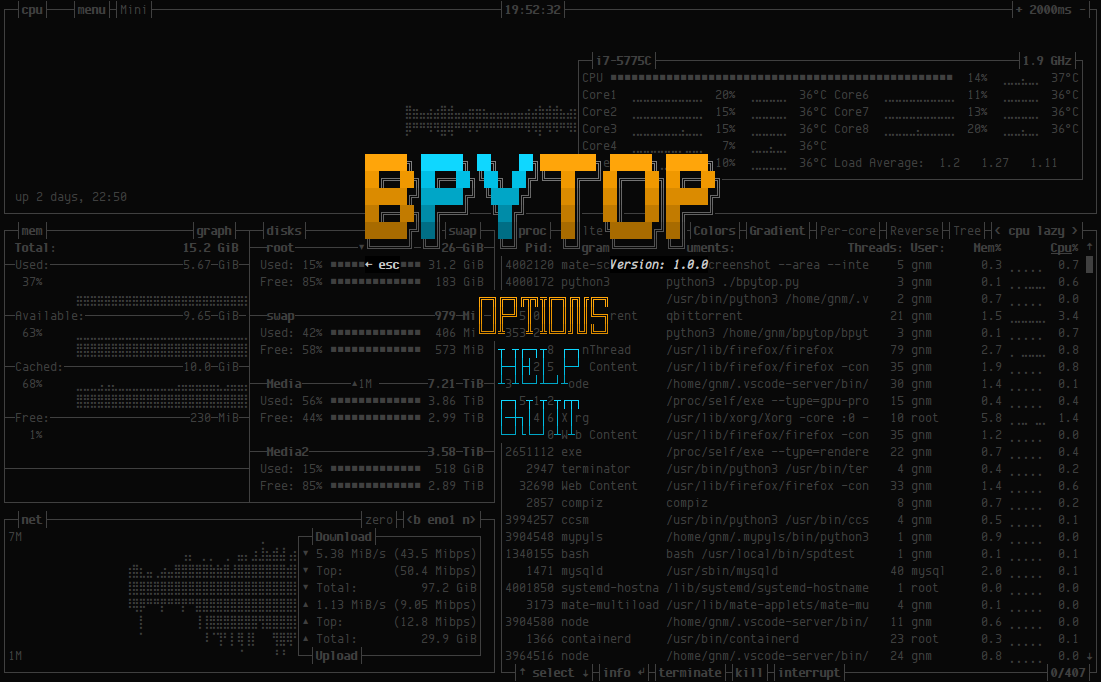
bpytop is a terminal user interface system resource monitor written in Python. It displays real-time usage statistics for CPU, memory, disks, network interfaces, and running processes in a single terminal window with an interactive interface.
The tool provides full mouse support with clickable buttons and scroll functionality for the process list. Users can select individual processes to view detailed statistics, filter processes with multiple search terms, and send signals (SIGTERM, SIGKILL, SIGINT) to selected processes. The interface includes auto-scaling graphs for network usage, current disk read/write speeds, and keyboard shortcuts for quick navigation between sorting options.
bpytop supports themes compatible with its predecessor bashtop, requires terminals with 24-bit truecolor support (or 256-color with conversion), and needs Unicode support for box drawing and braille pattern characters used in the graphs. The tool runs on Linux, macOS, and FreeBSD, with macOS requiring superuser privileges to display stats for all processes. It includes a configuration menu accessible through the UI for modifying all settings without editing files directly.
Installation
# via PyPi
pip3 install bpytop --upgrade
# via Homebrew
brew install bpytop
# via APT
sudo apt install bpytop