dolphie
Real-time terminal interface for monitoring MySQL/MariaDB and ProxySQL database performance and analytics
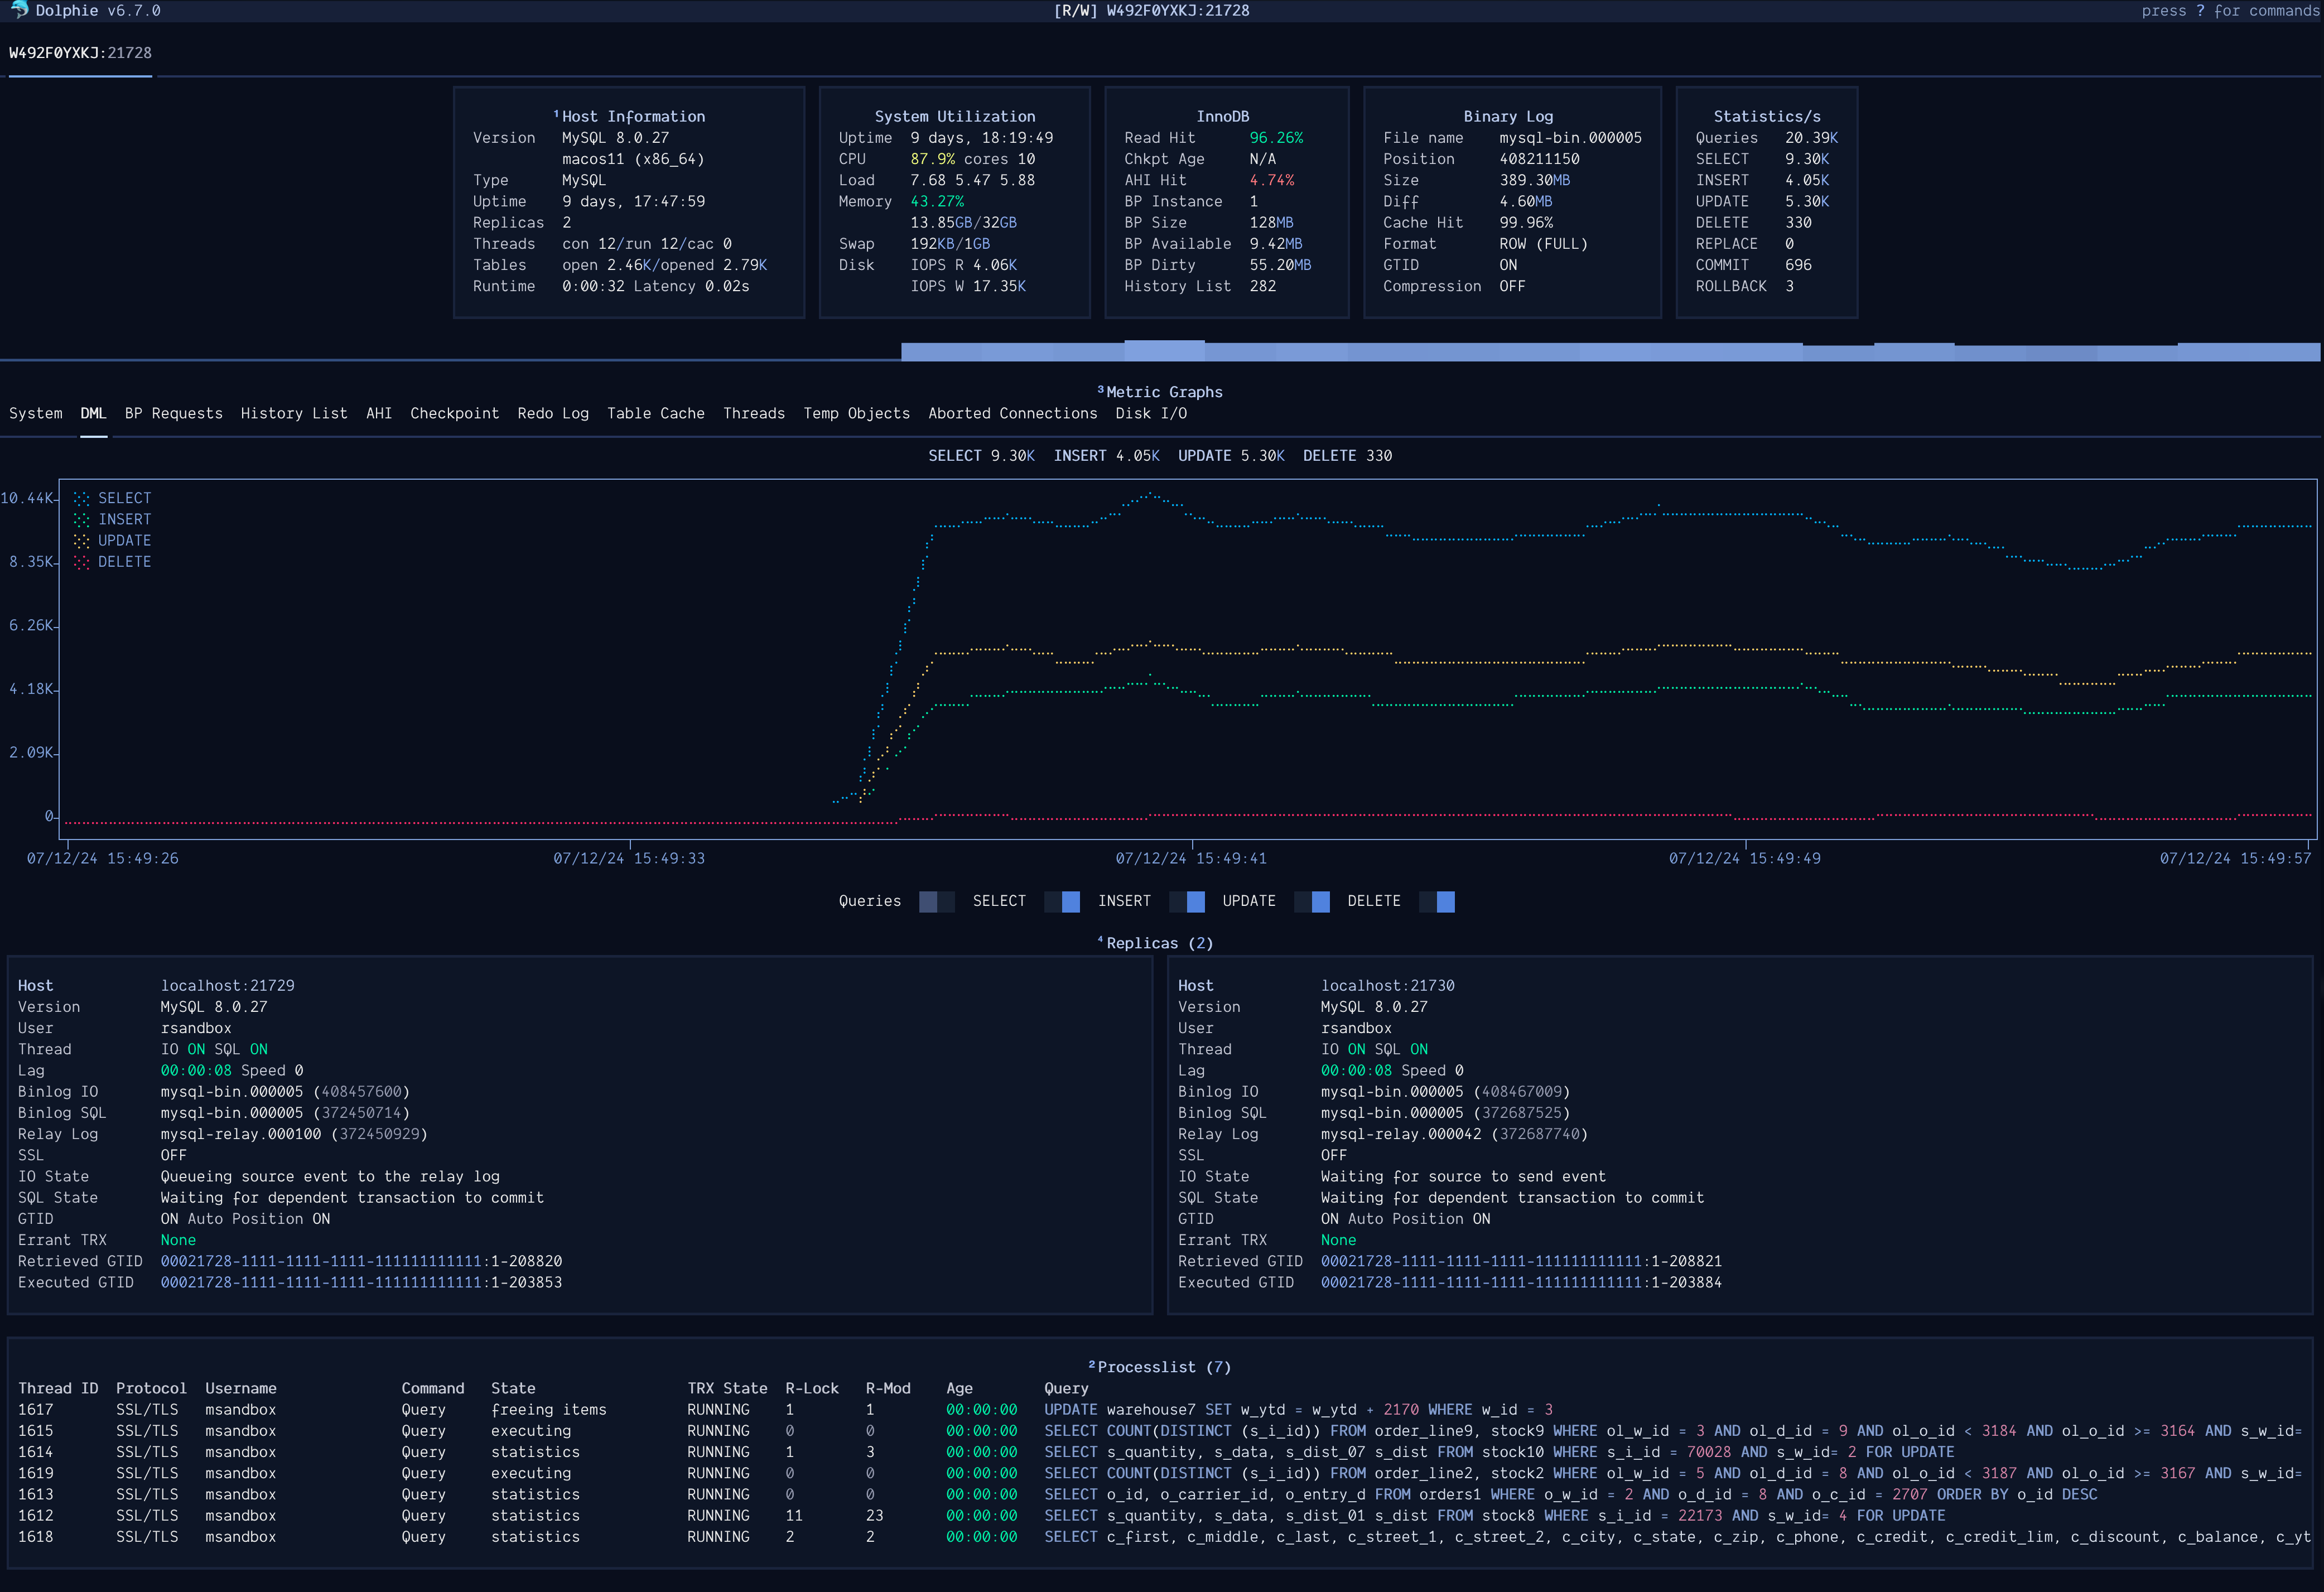
Dolphie is a terminal-based monitoring tool that provides real-time analytics and performance insights for MySQL, MariaDB, and ProxySQL databases. It displays multiple panels including dashboard metrics, process lists, replication status, metadata locks, DDL operations, and performance schema data in a single interface.
The tool connects to databases using standard MySQL connection methods including URI strings, credential profiles, SSL connections, and mysql_config_editor login paths. It supports monitoring AWS RDS/Aurora, Azure MySQL instances, and various MySQL/MariaDB versions from 5.5 to 9.x. For ProxySQL monitoring, it requires admin user access to utilize all features.
Dolphin includes record and replay functionality for capturing database sessions to SQLite files with ZSTD compression for later analysis. A daemon mode enables continuous background monitoring without the TUI interface, designed for always-on data collection. The tool offers configurable refresh intervals, panel selection, graph markers, and integrates with pt-heartbeat for more accurate replication lag measurements.
Database administrators, DevOps engineers, and developers working with MySQL-family databases would use this tool for real-time performance monitoring, troubleshooting database issues, and analyzing historical database behavior through recorded sessions.
Installation
# via Homebrew
brew install dolphie
# via pip
pip install dolphie
# via Docker
docker pull ghcr.io/charles-001/dolphie:latest