youplot
Command-line tool that generates Unicode plots from CSV/TSV data directly in the terminal
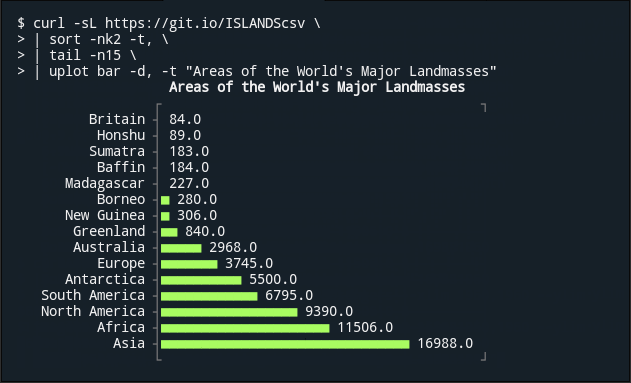
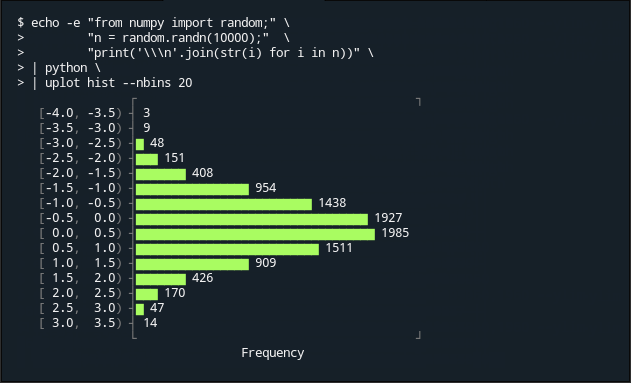
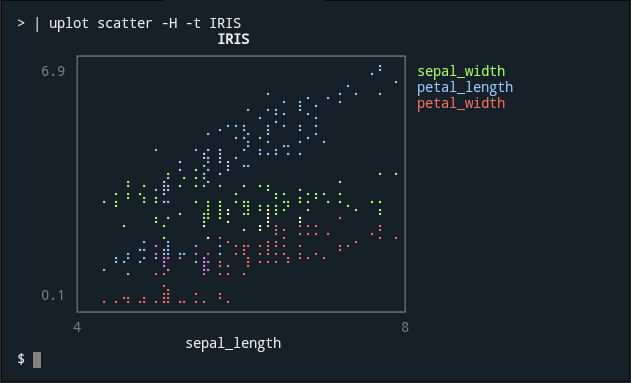
YouPlot is a command-line data visualization tool that renders charts and plots directly in the terminal using Unicode characters. It processes structured data from CSV/TSV files or standard input to create bar charts, histograms, line plots, scatter plots, density plots, and box plots without requiring external graphical applications.
The tool operates through the uplot command with subcommands for different chart types (bar, hist, line, scatter, density, boxplot). It supports common data operations like custom delimiters (-d), header handling (-H), and column formatting (--fmt). YouPlot can process data from stdin pipelines or files directly, making it suitable for integrating into shell scripts and data processing workflows.
Built on the UnicodePlot Ruby library, YouPlot includes specialized features like a count subcommand for frequency analysis, real-time plotting with progressive mode, and configurable output to either stderr or stdout. The tool accepts various input formats and provides options for plot dimensions, axis limits, colors, and titles. It's particularly useful for system administrators, data analysts, and developers who need quick terminal-based visualizations of structured data.
Installation
# via Homebrew
brew install youplot
# via Gem
gem install youplot
# via Nix
nix shell nixpkgs#youplot